|
Congratulations, your start-up received a term-sheet. Now what? If you’re a first time entrepreneur, you’ve been pounding the pavement for months – maybe even years – and a term sheet puts you one small step closer to funding. So, first, enjoy the moment. I know the feeling. Back in 2005, I landed my first sheet for a healthcare retail start-up I was working on. I remember thinking: This is it! Where do I sign? But don’t let the celebration last too long. You’ve got some analysis to do. The first step is building a pay-off diagram. A term sheet lays out the rules for splitting the spoils if and when your company has an exit event, such as a merger, IPO or liquidation. Thus, a pay-off diagram graphically shows what you get and what your investors get given different exit amounts. There are so many variables that go into a pay-off diagram, but I’ve built a model that covers the vast majority of early-stage term sheets. I’ve made it available as a Google Doc Template and you can access it here: There are other models out there, and I suggest you play with those too. Andrew Metrick and Ayako Yasuda have a great tool that allows you to model pay-offs across several rounds. Their model, however, is geared toward the VC investor more than the entrepreneur. Before you dive in, I’ll walk you through the basics. We’ll also look at a few examples. The Variables First, chose the type of security (cell B7):
Third, calculate the common stock on an as-converted basis. You only need to fill in three cells: The current common stock outstanding (D12) PLUS the number of shares issued (D13) and the convert-to-common ratio (D14) of the funding raising event. Fourth, what is the dividend rate (K12)? And is the dividend Cumulative or Accrued (K13)? Accrued means that outstanding dividends are simply paid back; for example, if $5M of preferred are issued and the rate is 8% and an exit occurs 5 years out, than the dividends due to the investor are $2M ($5M x 8% x 5 yrs). Cumulative means that the dividends are compounding. Using the same example, the investor would receive $2.35M in dividends plus principal (5M x 1.08^5). Cell K14 is only relevant to Participating Preferred Capped. Caps are usually a multiple of the investment. So a $5M investment with a 4-times investment cap means that the investor can participate up to $20M. If the investors share of the exit exceeds the capped amount, the investor will convert to common and realize the upside. Lastly, what is the expected time to exit (K9)? This is vital to calculating the dividends due. The Results: Same Variables, 4 Security Types For each security type, we'll assume the company is raising $5M. There are 20M shares outstanding and the company is issuing another 10M on an as-converted-to-common basis. Thus, the founders own 66 2/3 and the investors 33 1/3. Dividends are cumulative and pay a rate of 8%. An exit is expected in 5 years. Remember, the tool is flexible so plug in the terms relevant to your deal. I. Redeemable Preferred Redeemable preferred act just like debt, in that the investor is entitled to principal plus dividend but no upside. For this reason, it is highly unlikely that an early stage investor would accept RP. As you can see from the diagram below, the RP holder receives all the proceeds of the exit up until $7.35M. So in the event of a $50M exit, the investor receives $7.35M and the founders $50-7.35=$42.65M. 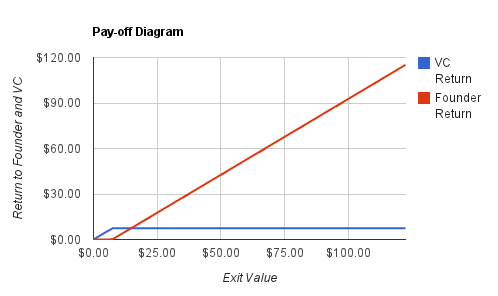 Redeemable Preferred Pay-off Diagram II. Convertible Preferred Convertible preferred give the investor the option to convert into common stock. Using our example, the investor will convert to common at a $22.50M exit. Why? Because 33 1/3% of $22.5M is $7.50M, which is greater than $7.35M from principal plus dividend. 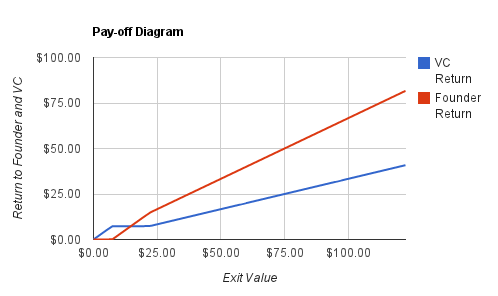 Convertible Preferred Pay-off Diagram III. Participating Preferred Participating preferred are commonly used by early stage investors. PP give the investor the best of both worlds: they receive dividend plus interest AND also participate in the remaining upside. So, in the event of a $50M exit, the investor will receive $5M in principal plus $2.35M in cumulative dividends. But that is not all. They will also receive an additional $14.21 [$50M-$7.35M)*33 1/3]. The grand total: $21.56M. 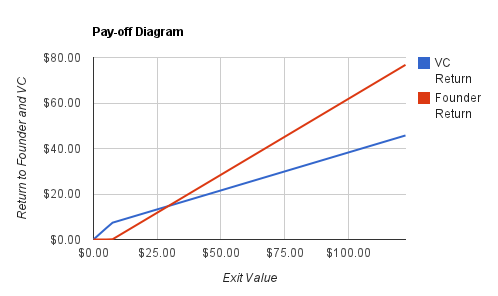 Participating Preferred Pay-off Diagram IV. Participating Preferred (Capped) Participating Preferred with a cap are similar to PP but, well, with a cap. Caps usually refer to some multiple of the original investment. In this example, let's assume the cap is 4x, i.e. 4 x $5M or $20M. This means that the investor can participate up to $20M. Thus, an exit between $47.5M and $60M will yield $20M. (You can see this plateau in the graph below.) An exit above $60M translates to a common stock value above $20M ($60M x 33 1/3). Therefore, the investor will convert to common and realize the upside. (Again, you can see the upwards slope at $60M). 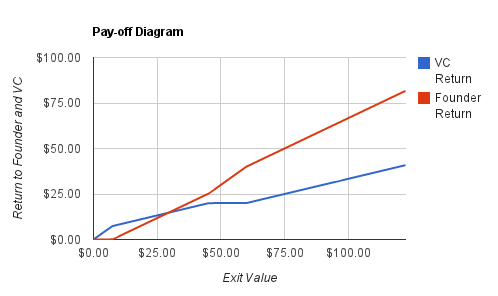 Participating Preferred (Capped) Pay-off Diagram Conclusion Security types and terms matter - a lot. Assuming a $75M exit, the founder that sells redeemable preferred will receive $67.65M. The same exit size but using participating preferred results in $45.10M. Hence, the type of security equates to a $22M difference on a $75M exit. In short, model out your term sheet before signing anything. The attached model should be applicable for a large majority of sheets. If your sheet has more nuances, try building your own. And don't be afraid to contact me; always happy to help. 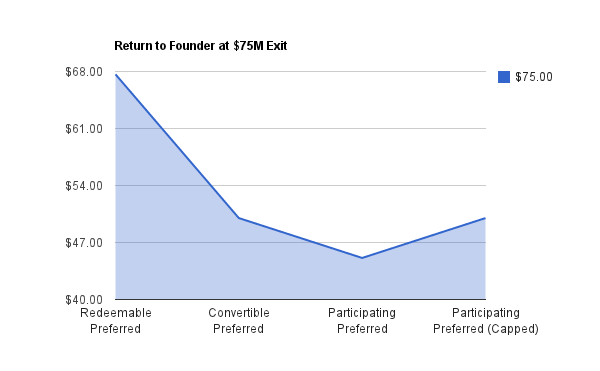
10 Comments
|
 JONATHAN STEIMAN
I'm the Founder and CEO of Peak Support. This blog is my take on early-stage companies and innovation. Every so often, there may be a post about culture, networking, family -- you name it. After all, what is a blog if it isn't a tad bit unstructured.
Archives
December 2016
Categories
All
|