|
Remember this Google commercial? Well, it is a brilliant idea that I saw put into action. My friend and co-worker just had a baby girl. About three weeks after the birth, he created a Google account for her. Here is an email I sent her. 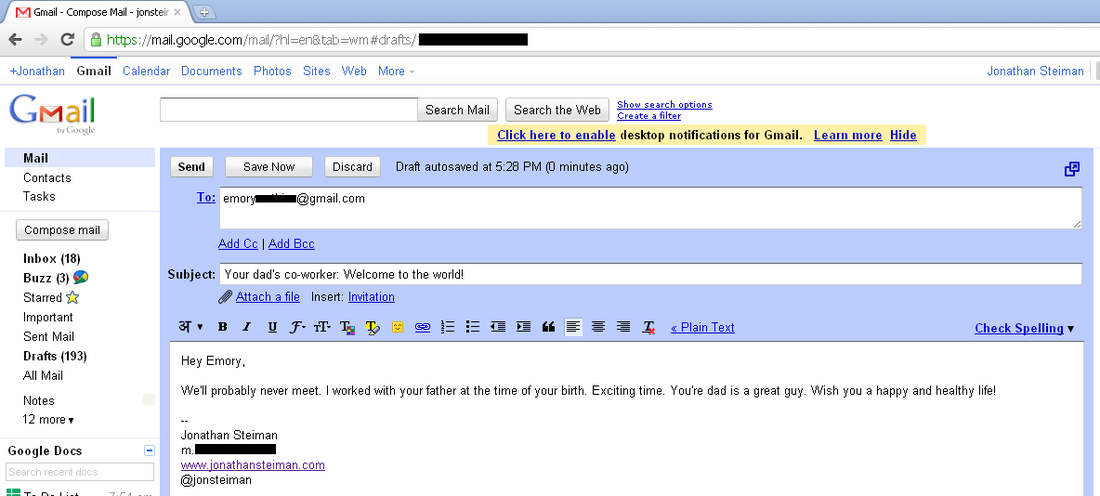
0 Comments
Google, rather quietly, released a new Doc product called Fusion Tables. Tables is a database tool, which means that Google is now matched one-for-one with the Microsoft Office Suite. Like all Doc products, Tables is intuitive, collaborative and integrated with the web, especially location-based data. Tables is not nearly as robust as Access. But most people don't need that much power, which is why Tables is a great tool for anyone with the slightest data analysis needs.
Tables is also focused on being a data repository. In other words, if you have a dataset that you want to share with the world, simply make it "public" on Tables. And vice versa; if you need a dataset, peruse the public tables located here. Right now there are about 100 sets, including Goals at the 2010 World Cup, Coffee Production, and Homicides in Colombia. Testing Tables: Uploading and Analyzing One Data Set The best feature of Tables is the ability to overlay information onto a map. To familiarize myself with this functionality, I needed a rich data set that was not too cumbersome. The Bureau of Labor and Statistics is a natural, so my first test is an analysis of firm size and employment by each state. First, I had to create the table. This could not be any easier. To create a new table you are given three options: From this computer (i.e. an Excel or Access file), From a Google Spreadsheet, or Empty Table. Since I downloaded the Excel dataset from the BLS, I chose the first option: From this computer. The next step is to confirm that the columns are correctly formatted. Amazingly, Google correctly recognized every column. For example, the first column was State, which I thought would have been tagged as text but was correctly recognized as location. The next step is attributing the data. This is key for sharing tables with the public. If you plan on publishing the table, proper attribution is vital, or else it is of little value to the research community. With the file uploaded and the data attributed, it was time for fun: analysis. My first stop was the Intensity Map, which is located in the Visualize drop-down. At first, the data was skewed because it included employment by firm size for all fifty states as well as the United States as a whole. Also, the data was noisy because it included every firm size, ie 0-4 employees, 5-9 employees, etc. Therefore, I needed filters, which were extremely easy to add; simply click the "options" link. Here is a screen shot of the Intensity map showing the number of companies with over 500 employees. Merging Two Tables: Good, as long as you do not need a calculation I ran into my first problem / bug while merging two tables together and then performing a calculation. Basically, I wanted to understand the data on a per capita basis, so I created a second table with state-by-state population going back to 2004. (I made it public here). Merging the two tables was simple. In the original table, I simply clicked on “Merge” and was presented a two question “wizard.” The first question was “which columns do you want to match.” This is equivalent to dragging the cursor between two tables in Access. In this instance, I chose to link STATE data together, so that I would see employment by state along with population. The second question is a no-brainer: which table do you want merged. Next, I wanted calculate the Enterprises per Capita by dividing the population by the number of firms. So I went to Edit, Add Formula and wrote in my command. It didn’t work. For some reason, I could not get a merged table to perform a calculation. My work-a-round was exporting the newly merged table to Google Docs Spreadsheet, and then importing it back in as one table. When I did this, I was able to perform the calculation. This is not an acceptable solution because the table is no longer dynamic. If anyone out there knows what I’m doing wrong, please shoot me a note or write a comment below. Conclusion: A Key Tool for Any Analyst Aside from my inability to calculate, Google Tables is a great resource. My intensity map of firm size is just the tip of the iceberg. Check out these amazing examples. Lastly, Tables has the potential be transformative. Humans advance on data. Right now, there is a vast expanse of data, but it is silo'd across many systems and written in different formats. A central, crowd-sourced repository of data will improve the quality of analysis, all while reducing the time wasted finding, verifying and cleansing. |
 JONATHAN STEIMAN
I'm the Founder and CEO of Peak Support. This blog is my take on early-stage companies and innovation. Every so often, there may be a post about culture, networking, family -- you name it. After all, what is a blog if it isn't a tad bit unstructured.
Archives
December 2016
Categories
All
|