|
Congratulations, your start-up received a term-sheet. Now what? If you’re a first time entrepreneur, you’ve been pounding the pavement for months – maybe even years – and a term sheet puts you one small step closer to funding. So, first, enjoy the moment. I know the feeling. Back in 2005, I landed my first sheet for a healthcare retail start-up I was working on. I remember thinking: This is it! Where do I sign? But don’t let the celebration last too long. You’ve got some analysis to do. The first step is building a pay-off diagram. A term sheet lays out the rules for splitting the spoils if and when your company has an exit event, such as a merger, IPO or liquidation. Thus, a pay-off diagram graphically shows what you get and what your investors get given different exit amounts. There are so many variables that go into a pay-off diagram, but I’ve built a model that covers the vast majority of early-stage term sheets. I’ve made it available as a Google Doc Template and you can access it here: There are other models out there, and I suggest you play with those too. Andrew Metrick and Ayako Yasuda have a great tool that allows you to model pay-offs across several rounds. Their model, however, is geared toward the VC investor more than the entrepreneur. Before you dive in, I’ll walk you through the basics. We’ll also look at a few examples. The Variables First, chose the type of security (cell B7):
Third, calculate the common stock on an as-converted basis. You only need to fill in three cells: The current common stock outstanding (D12) PLUS the number of shares issued (D13) and the convert-to-common ratio (D14) of the funding raising event. Fourth, what is the dividend rate (K12)? And is the dividend Cumulative or Accrued (K13)? Accrued means that outstanding dividends are simply paid back; for example, if $5M of preferred are issued and the rate is 8% and an exit occurs 5 years out, than the dividends due to the investor are $2M ($5M x 8% x 5 yrs). Cumulative means that the dividends are compounding. Using the same example, the investor would receive $2.35M in dividends plus principal (5M x 1.08^5). Cell K14 is only relevant to Participating Preferred Capped. Caps are usually a multiple of the investment. So a $5M investment with a 4-times investment cap means that the investor can participate up to $20M. If the investors share of the exit exceeds the capped amount, the investor will convert to common and realize the upside. Lastly, what is the expected time to exit (K9)? This is vital to calculating the dividends due. The Results: Same Variables, 4 Security Types For each security type, we'll assume the company is raising $5M. There are 20M shares outstanding and the company is issuing another 10M on an as-converted-to-common basis. Thus, the founders own 66 2/3 and the investors 33 1/3. Dividends are cumulative and pay a rate of 8%. An exit is expected in 5 years. Remember, the tool is flexible so plug in the terms relevant to your deal. I. Redeemable Preferred Redeemable preferred act just like debt, in that the investor is entitled to principal plus dividend but no upside. For this reason, it is highly unlikely that an early stage investor would accept RP. As you can see from the diagram below, the RP holder receives all the proceeds of the exit up until $7.35M. So in the event of a $50M exit, the investor receives $7.35M and the founders $50-7.35=$42.65M. 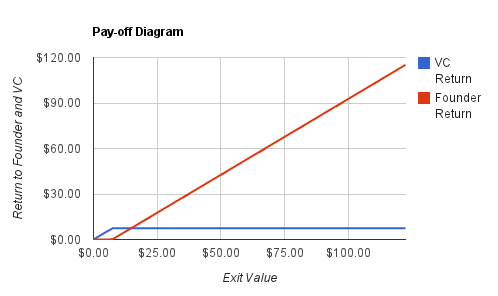 Redeemable Preferred Pay-off Diagram II. Convertible Preferred Convertible preferred give the investor the option to convert into common stock. Using our example, the investor will convert to common at a $22.50M exit. Why? Because 33 1/3% of $22.5M is $7.50M, which is greater than $7.35M from principal plus dividend. 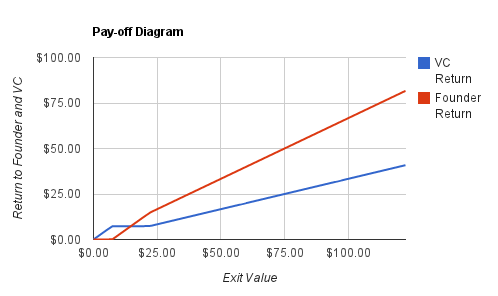 Convertible Preferred Pay-off Diagram III. Participating Preferred Participating preferred are commonly used by early stage investors. PP give the investor the best of both worlds: they receive dividend plus interest AND also participate in the remaining upside. So, in the event of a $50M exit, the investor will receive $5M in principal plus $2.35M in cumulative dividends. But that is not all. They will also receive an additional $14.21 [$50M-$7.35M)*33 1/3]. The grand total: $21.56M. 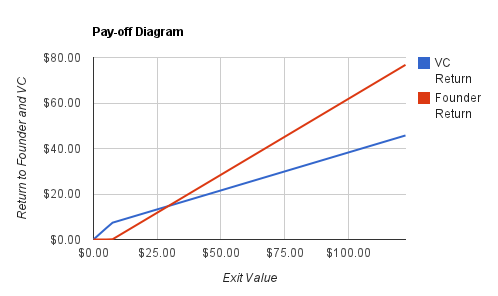 Participating Preferred Pay-off Diagram IV. Participating Preferred (Capped) Participating Preferred with a cap are similar to PP but, well, with a cap. Caps usually refer to some multiple of the original investment. In this example, let's assume the cap is 4x, i.e. 4 x $5M or $20M. This means that the investor can participate up to $20M. Thus, an exit between $47.5M and $60M will yield $20M. (You can see this plateau in the graph below.) An exit above $60M translates to a common stock value above $20M ($60M x 33 1/3). Therefore, the investor will convert to common and realize the upside. (Again, you can see the upwards slope at $60M). 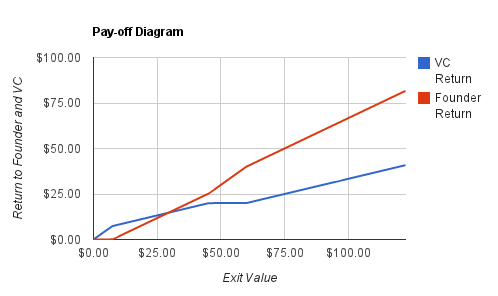 Participating Preferred (Capped) Pay-off Diagram Conclusion Security types and terms matter - a lot. Assuming a $75M exit, the founder that sells redeemable preferred will receive $67.65M. The same exit size but using participating preferred results in $45.10M. Hence, the type of security equates to a $22M difference on a $75M exit. In short, model out your term sheet before signing anything. The attached model should be applicable for a large majority of sheets. If your sheet has more nuances, try building your own. And don't be afraid to contact me; always happy to help. 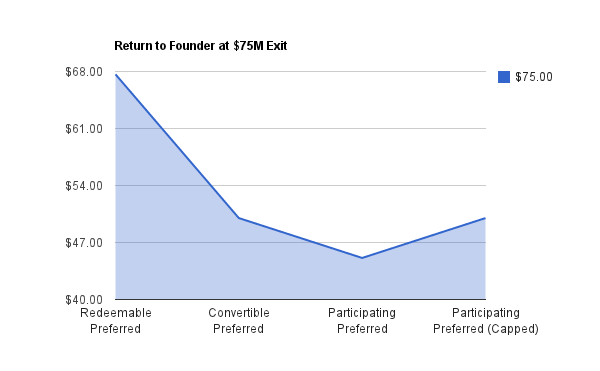
10 Comments
The following article was first published in the MIT Entrepreneurship Review on April 1, 2012.
Economic expansion works like this: One trigger innovation spawns a number of supporting industries. The automobile, for example, brought us service stations, fast food chains, asphalt and suburban homes. Steel is another great example; the sturdy and affordable metal birthed the age of modern infrastructure. Today, the world of web and mobile services has spawned a new and booming industry. The industry is called “Big Data,” and last week the key players got together in New York City at the GigaOM Structure:Data Conference. Big Data is the result of the Internet and the decline in the cost of storage. To illustrate, just think about how much data you created and stored today. If you’re like me, you shot off a few emails, liked a Facebook comment, retweeted a Tweet and searched around for cheap plane tickets -- then ate breakfast. And this is only a sliver of my day’s data history. Swiping my debit card, getting surveillance-video taped on the subway platform and key-carding into my office created additional data points. In short, society is creating an exponential amount of data; 1,750 exabytes in 2011, according to the Economist. The most referenced fact at the conference was that more data was created in the last two years than in all of history. And it isn’t slowing down. The growth of the Internet and the increased adoption of sensors in everything from cars to microwaves will create ever-growing amounts of data. Data is “constant and relentless,” said Comscore CTO Mike Brown. The Business of Big Data Big Data is the business of making sense of these disparate data points. The first and most obvious use is commercial, more specifically marketing. Nirvana in the ad world is tying your likes, tweets, check-ins, credit card transactions, and even your eye patterns when you look at a billboard to deliver the most relevant advertisement or product recommendation. Big data goes well beyond commercial use, though. Epidemiology and Big Data are a natural fit. Disease-chasers can identify pockets of illness by tying together Facebook comments, Google searches for doctors, phone calls to doctors offices, and retail store transactions for cough syrup. And of course security is big on Big Data. The conference hosted James Woolsey, the former CIA director, who spoke about using Big Data to identify security threats to the US electric grid. Key Trends: Real-time analytics and democratization of Big Data There were two main themes from the conference. The first is the quest for real-time analytics. For the most part, analysis of Big Data is done in batches. Take a large retailer, for example. It may update its predictive models with end-of-day or maybe even end-of-month SKU data. Batch updating is adequate at best, since a lot can change in a week’s time. Thus, all of the vendors at the conference pitched existing or soon-to-be-released products that enabled real-time predictive analytics. That means that once you scan that carton of milk and pack of razor blades the store’s model is updated and refined. The second trend is the democratization of Big Data. For the last several years, Big Data has been a luxury only the top technology firms could afford. If you weren’t Google or Facebook or Amazon you simply could not attract and retain the world’s top data scientists. That is changing, though, thanks to vendors offering out-of-the-box Big Data solutions. Skytree, for example, has brought to market a solution that enables companies that aren't tech-centric to tap into their data. Skytree sits between the data, which can be stored in a relational database or a Hadoop cluster, and a front-end product like R or Matlab. Essentially, Skytree pulls in the data, looks for patterns and insight, and then pushes the data to front-end tool that most analysts are familiar with. In the coming months, the company will be releasing real-time capabilities. What’s Next? Big Data is slowly seeping into the mainstream conversation. Sometimes it creates outcries; for example, The NY Times Magazine story about Target using customer data to identify pregnant woman in order to send them coupons when their “brand loyalties are up for grabs.” Other times, Big Data has been rejoiced. CellTel from Africa, for example, predicted the location of massacres in the Congo based on pre-paid phone card sales. And now the US government is fully supporting Big Data. On March 29th, the White House announced $200 million of funding to “greatly improve the tools and techniques needed to access, organize, and glean discoveries from huge volumes of digital data.” In short, Big Data is a great opportunity. From a societal perspective, I’m reminded of the Saturday morning NBC public service announcement: The More You Know. We have all of this data. Now we just need to extract insights from it. From a business perspective, Big Data is booming. The culmination of ever expanding data points and practical analysis of that data equates to billions of dollars of value created for business, governments and people. |
 JONATHAN STEIMAN
I'm the Founder and CEO of Peak Support. This blog is my take on early-stage companies and innovation. Every so often, there may be a post about culture, networking, family -- you name it. After all, what is a blog if it isn't a tad bit unstructured.
Archives
December 2016
Categories
All
|