|
I've been working with Enroot in a board capacity going on 5 years. I would not normally reach out and solicit a donation. But I truly believe in this organization and want to make it as successful as possible.
I'll share three reasons why Enroot is a great non-profit to support. First, our work matters more than ever. Enroot helps recently arrived immigrant students thrive in public schools. Our students come from all corners of the globe - Syria, Sudan, Ethiopia, Nepal, El Salvador plus dozens more. In the past, these students have felt welcomed. America represented a dream, a beacon on a hill. Today, our kids feel like targets. One of our school sites was recently vandalized with swastikas. Our students are asking, "What is a deportation force?", "I'm Muslim; do I need to register?" We hope that a year of record donations sends the message: "You're welcome in America, in the city you live, in the school you attend." Second, Enroot is good at the work it does. Moving to a new school is always difficult. Now, add in the fact that the new school is in a new country with a new culture where people speak a foreign language. By supporting our students early with a dedicated mentor, a dedicated tutor, supplemental trainings AND a paid internship, we change the trajectory of their lives significantly and positively. Our students graduate high school and attend college at twice the rate of their peers. Third, the Enroot team is committed to affecting change while being sound stewards of donor money. Early in my career, I worked at nationally lauded non-profits, including Teach For America and The Doe Fund. I've been close to other non-profits via Hannah, notably the Clinton Global Initiative and Community Servings. Based on my experience, I can say with confidence that everyone on the Enroot team is an extreme professional. This group will no doubt continue to effect major change over the next several decades. They are responsible fiduciaries. If they were not, I would not volunteer my time nor donate my money. This is why I have the confidence to ask you for your money. Please give any amount that you're comfortable with. You can make a ONE-TIME DONATION or a MONTHLY DONATION. You can also send a check made out to ENROOT INC. to the address below. And please feel free to learn more by reviewing our Guidestar (link below). Wishing you a happy and healthy New Year! Gratefully, Jonathan Enroot 99 Bishop Allen Drive Cambridge, MA 02139 Guidestar: http://www.guidestar.org/profile/04-2103961
1 Comment
Airbnb brings out the best in people. As the UK closes its borders and the Republican nominee for US President chants “Build a Wall!”, Airbnb hosts are opening their homes and cities to people from all over the world. But Airbnb also fosters discrimination. Check out the #AirbnbWhileBlack campaign on Twitter and you’ll find hundreds of stories of black guests being denied by hosts. Also, black hosts receive fewer requests; in other words, guest discriminate too. And while there is not much activity on the #AirbnbWhileMuslim campaign, it’s a problem, too. As a white male Airbnb host, I wanted to make sure that I was not discriminating, consciously or unconsciously. To do this, I needed a system to divorce race and religion from my decision-making. So I came up with a standard by which all requesting guests must pass. The parameters for accepting a reservation are:
It's that simple. So if "Ashley from Concord, New Hampshire" whose profile picture is of her looking super cute at Fenway Park fails to meet the minimum standard, she is denied. On the flipside, a man that doesn't look like me and doesn't have a name that sounds like mine meets the minimum standard, I say "Welcome!" I like this system because it levels the playing field for all inquiring guests. But there is a flaw. If other hosts discriminate, is it fair to use their reviews in my standard? In other words, it's possible that white hosts have unfair expectations of black and Muslim guests and therefore review them worse, or not at all. Ideally, a standard should not depend on another (possibly discriminatory) person. Compensate Non-discriminators, Tax Discriminators If Airbnb is serious about combatting discrimination -- which they are -- I suggest a system that rewards non-discriminators and taxes discriminators. Here’s how it would work. When a host signs-up they establish a standard. One host could chose 4 verifications and 10 reviews (high standard) while another host may be comfortable with 1 verification and 0 reviews (low standard). When a guest requests a booking they are scored against the hosts standard. If the guest passes the host’s standard If the guests passes the standard, the request is sent to the host. But instead of seeing the full profile, the host ONLY sees non-identifying information (booking details, guest reviews/verifications, guest message). The host does not see the person’s name, picture or citizenship. With this non-identifying information, the host can accept, deny or request to see the full profile. If the host accepts or denies based solely on non-identifying information, they are rewarded in the form of lower transaction fees and better search results. If the host requests to see the guest’s full profile and then accepts, they are neither penalized nor rewarded. And lastly, if the host asks to see a guest’s identifying information and then denies the booking, they are penalized with higher fees and worse search results. Why? Because by this point, the host was comfortable with everything (booking date, earnings, guest message) but they weren’t comfortable with the guest. Since they denied the guest, it can be assumed they did so based on an identifying factor. If the guest fails the host’s standard Hosts may want to see all requests, even from guests that don’t meet their predetermined standard. In these instances, the host sees all information immediately. If the host accepts a sub-standard guest, for lack of a better term, the host is rewarded. Now this is where it get’s interesting. If the host denies the guest, the guest is prompted with a one-question survey: “Do you believe the host denied you for any reason other than the date and nature of your request?” If the guest responds “No”, than the host is neither penalized nor rewarded. But if the guest responds “Yes”, then the basic facts of the case (guest profile, host profile, messages between the guest and the host, and booking details) are sent to a community of hosts and guests. If the community determines no discrimination, then host is neither penalized nor rewarded. If, however, the majority of guest and hosts find discriminatory practices, the host is penalized. While this sounds complicated, several companies (including Airbnb) are already tapping into their user-base with Directly. 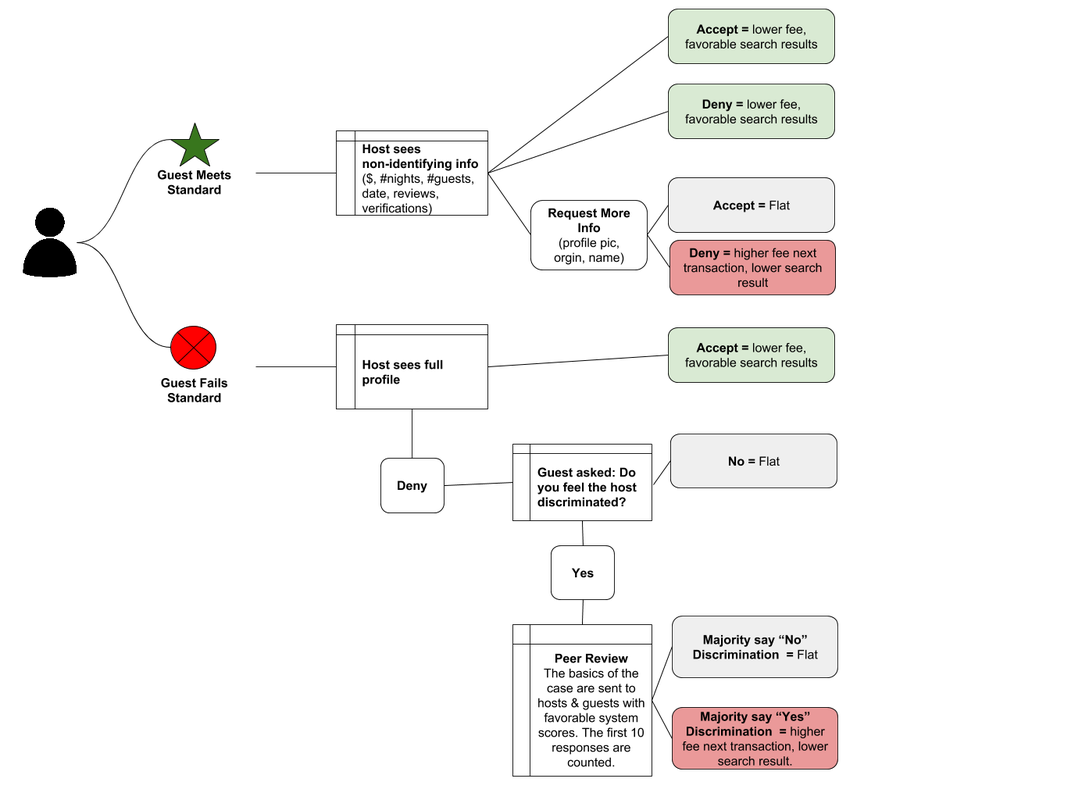 Better than Instant Book
Today, Instant Book works similarly. If a guest meets a certain criteria, they can book instantly. But I do not use Instant Book for two reasons. First, you have to be maniacally diligent with your calendar. We got burnt early on with an Instant Book request. One Friday morning, my wife and I decided we wanted to leave town for the weekend. Before I could update the calendar, someone booked. Since we don’t like guest arriving when we are not home, I had to cancel the reservation, which resulted in a penalty. Second, I need the freedom to deny a person based on factors such as their agenda for the trip, the size of their party, or whether they have a dog. For instance, if a guest is requesting one night to host a dinner party for 10 people, I’m denying! That is way too much work and stress for one night. With Instant Book, you don’t have the freedom to deny based on the guests note. Face tattoos and Confederate Flags This system is not perfect, unfortunately. Admittedly, I judge guests based on their photos. Call me old fashioned, but I’m weary of people with face tattoos. I’m also hesitant to welcome someone into my neighborhood and home if they are wearing an offensive shirt in their profile picture; for example, the Confederate Flag or a US President with a Hitler mustache. In the end, this is a form of discrimination and the goal is reduce discrimination on the Airbnb platform, so I’m happy to give up these identifying factors for the greater good of the system. This past September, our close friend Jean passed away. Jean lived on New Hamburger, a wonderful artist, carpenter and farming community in Central Vermont. So what happens when a key member of a creative community passes away? The community rallies together to build and decorate the casket. 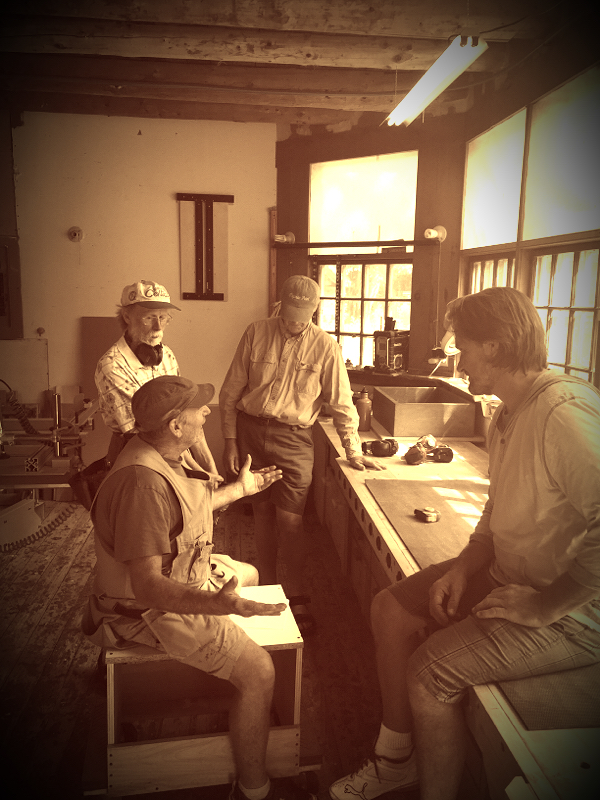 A few months before Jean's passing, David S. had built a casket for another close friend. He printed out the plans and briefed Barney, Sam and Bruce.  The required pieces of stock. From here, the team split up and milled the required pieces.  To make a custom casket, we first need to understand Jean's dimensions - her height, width and depth. When we saw the numbers on paper the dimensions seemed too small - especially the depth. To get comfortable with the depth, we mocked up a test depth. Here Bruce, Jean's son, tests the depth. In the end, the depth and width were correct. We made a mistake on the length; we built the casket using Jean's standing height but we failed to factor in that her feet would point downward when in repose.  Sam cuts to length 10'' boards that will be used for the sides, top and bottom of the casket.  Rounding and styling the buttresses.  All of the stock is ready. Now, it's time to assemble.  Bruce nails the sides to the corner post.  Sam explains the plan to Julie.  The four walls are built.  Bruce adds the bottom board. The bottom boards are perpendicular to the sides. This is a stronger construction than going lengthwise.  Final sanding of the bottom boards.  Game-planning the top.  Bruce fastens the top boards together.  Construction is finished. 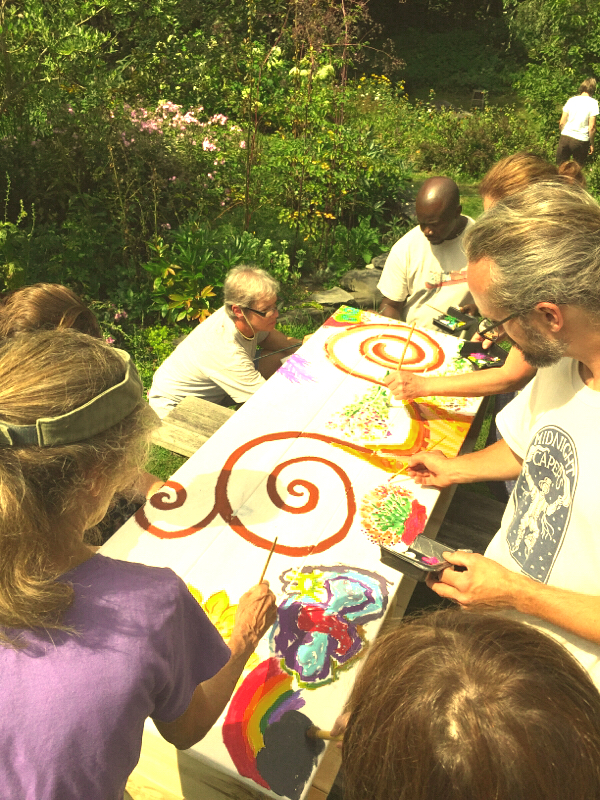 The next day, friends and family gathered and painted the casket. Each painting symbolized something about Jean's life. 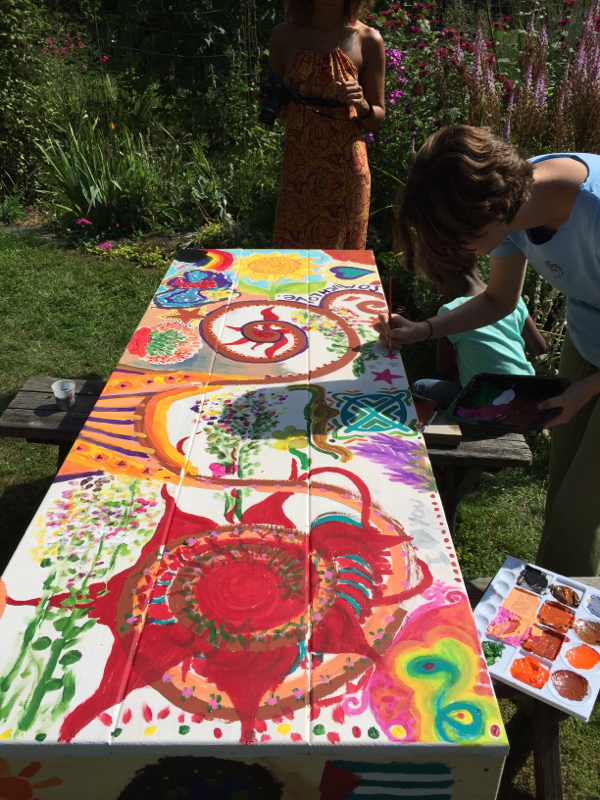 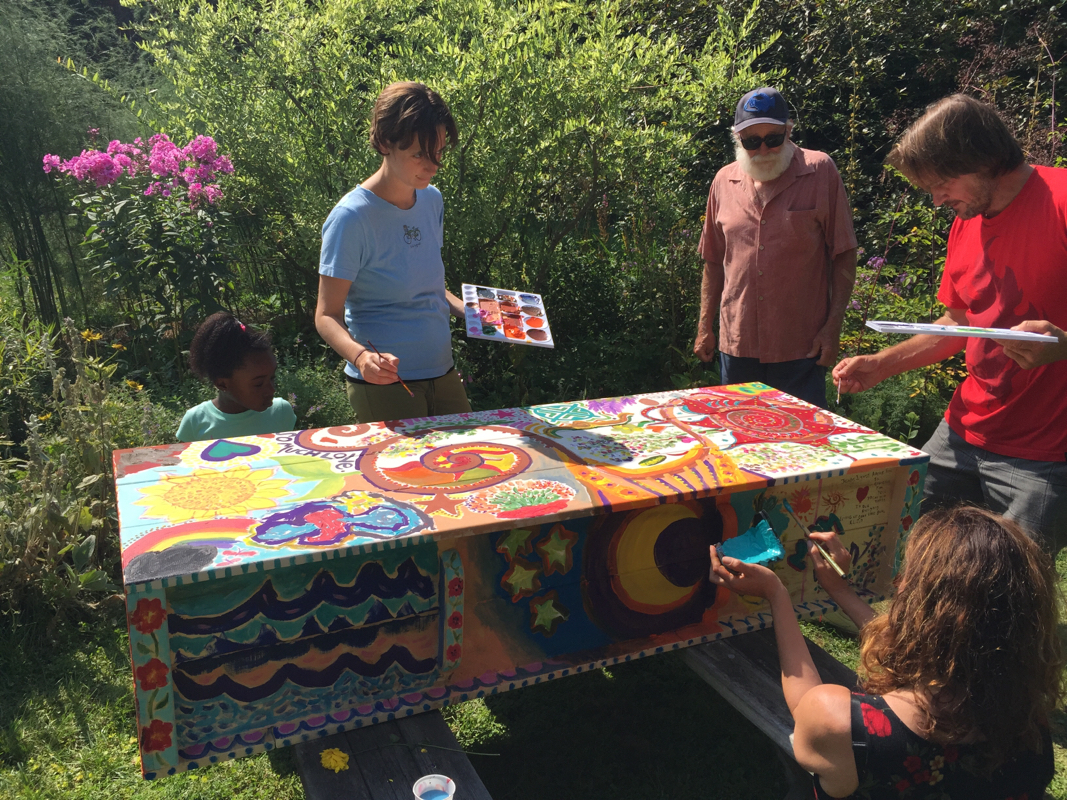 The final product! We love you Jean. 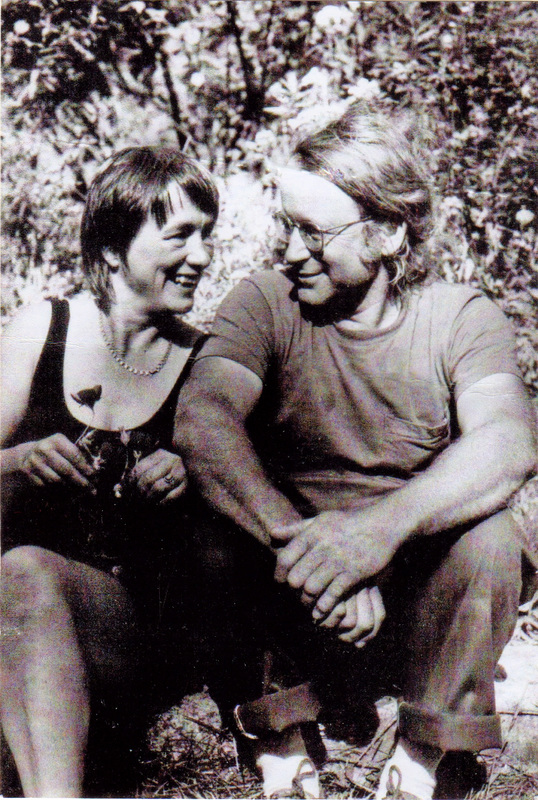 Jean and David. To date, Airbnb has made great strides to improve the host experience. Today's calendar, for example, is much more flexible - amen. Also, hosts are seeing more review data, which is hugely helpful in identifying where to improve. But there is so much more that needs to be done. For example, power-hosts need account permissions so they can safely share their accounts with support professionals. Hosts need more data around occupancy rates and financial metrics. Lastly, there is a great opportunity to help hosts become more accessible. I was enlightened to accessibility by my father-in-law, the author of The Motion Minded Kitchen. We are almost through 3-quarters of "the year of the host." I'm looking forward to seeing what gets pushed in the last quarter. America embraces movements that empower individuals. This is at our core, from the Constitution to the start-up craze in Silicon Valley.
Airbnb exemplifies America. Airbnb empowers micro-entrepreneurs to tap into unused assets and make extra money. This is exactly what my wife and I did. We had an in-law apartment that was used two weeks per year. We posted it on Airbnb and now we are generating enough income to pay down student loans. It doesn't sound like a lot but when those monthly bills are covered it makes all the difference in our world. There are additional benefits, too. First, we meet amazing people. For instance, we hosted two entrepreneurs working on 3D bio-printing; I'm now helping them grow their business. Airbnb is good for the environment; tap into enough unused in-law apartments and you don't need to ruin the landscape with a hunking concrete and steel hotel. Lastly, Airbnb saves money for travelers, which they put back into local restaurants and tourist attractions. Is Airbnb perfect? Of course not. No industry is perfect. In my community, Airbnb guests and hosts don't pay hotel tax. Theoretically, this may be negatively impacting the municipal budgets for police, fire, EMT. If after analysis this holds true, I would be in favor of taxation. Who is really getting hurt? Hotels. Airbnb is the greatest disruption that the hotel industry has ever seen. Marriott and Starwood have invested billions into long-term assets. Airbnb is competing with them - dare I say, outcompeting them - without laying a single brick or delivering a single room service meal. This is a good thing. We welcome disruption. It's why we have the greatest economy in the world. In closing, Airbnb is an invaluable service for guests, hosts and neighborhoods. As lawmakers, it's in your interest to support Airbnb and the millions of individuals that Airbnb positively impacts. Every start-up dreams about being mentioned in The New York Times. A dash of NY Times ink provides credibility to your idea and drives usage, or so the logic goes. But in today's rapidly changing media landscape, does this still hold true? Based on my experience with TalkTo, the answer is a resounding NO. In fact, even large websites like BuzzFeed may not provide a huge boost to your business. The holy grail of driving traffic: raving fans writing genuine reviews for a small but passionate readership. I came to this conclusion by comparing how press coverage from three outlets improved our average daily iOS downloads. I looked at daily downloads 5 days prior to each article and 5 days after each article. TalkTo, which was acquired by Path in June, has been covered by many of the major publications but for this study I looked at mentions in The New York Times (Old Media), BuzzFeed (New Media), and Tumblr (Social Media). A Tumblr blog posted by an angsty 20-something from Canada named HeyitsJnnfr increased downloads by a factor of 38; in other words, if we got 1 download prior to the blog, we got 38 the following week. Jennifer nailed a particular use-case: "people who suffer from social anxiety where telephone communications might be triggering or uncomfortable." This message resonated with her 2,500 followers who started to like and reblog the post. As of today, this obscure blog has been shared by 89,000 people. In comparison, BuzzFeed, with 1.41 million Twitter followers and 3.8 million Facebook likes, drove a 10X increase in downloads. The New York Times (13 million Twitter, 8.5 million Facebook) drove slightly more downloads than BuzzFeed and but far fewer than Heyitsjnnfr's post. 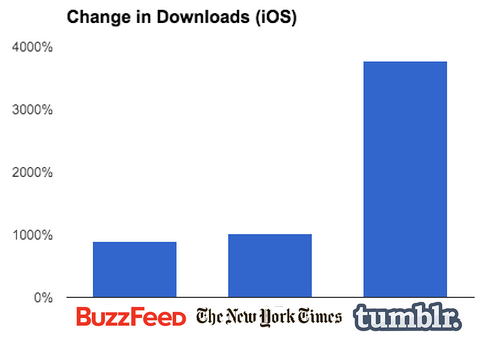 Downloads are only half of the battle. The other key element is conversion, i.e. the number of people that download, open and use the app. In this metric, BuzzFeed was the best. As you can see from the chart below, the 5-day before/after change in BuzzFeed New Users outpaced downloads. Tumblr, on the other hand, was pretty abysmal: A 38X increase in new users only yielded a 16X increase in New Users. The New York Times was similar to Tumblr. 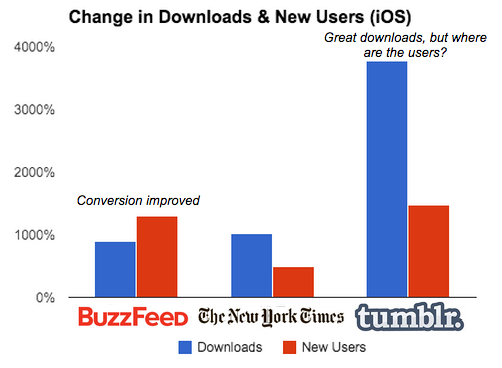 Key Take Aways
I recently helped Cambridge Community Services define it's vision. As part of the exercise, the Board did a full-day offsite. To kick-off the offsite, the meeting leader asked us to think for a few minutes and then write down our individual core values. I'm a huge proponent of core values. At Teach For America, I saw core values guide decisions and settle debates. At TalkTo, core values of exceptional service, team, integrity and improvement are the fabric of our work. Core values, simply put, are guideposts for any challenge and every opportunity. Despite my deep appreciation for shared values within organizations, I never thought about my own personal core values. Thus, I found this exercise very helpful. Below is the notecard that I penned in 5 minutes; but the words will last a lifetime. Grab a pen, a piece of paper and write down your Core Values. And next time you are working with someone and they are struggling with a decision, ask them "What are you core values?" The answer to that question will guide the decision. 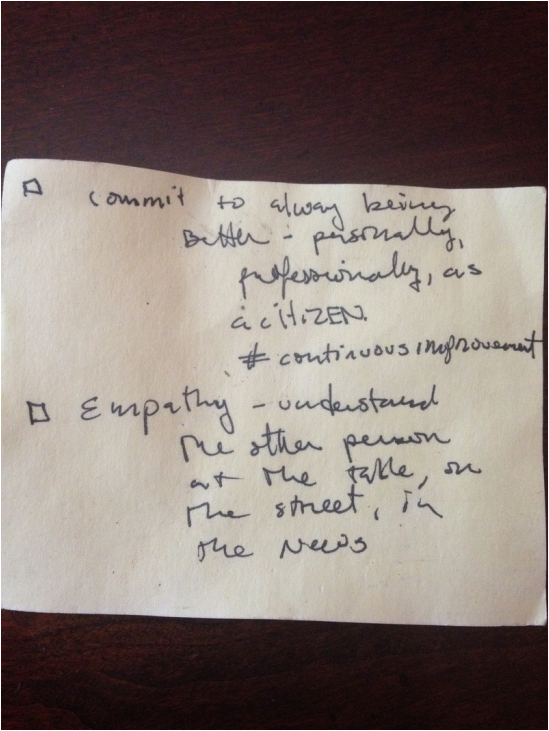
I previously wrote about creating a Word Tree with user reviews in order to gain customer insights. Another approach which isn't as valuable but is extremely beautiful is the Word Cloud. The cloud allows you to see the key words that people use to describe your product. Below is the result of running TalkTo's 1,436 iTunes and Google Play reviews through Jason Davies' Word Cloud tool. Paired with the word tree, the cloud is powerful because it highlights the key root words to run through the word tree. 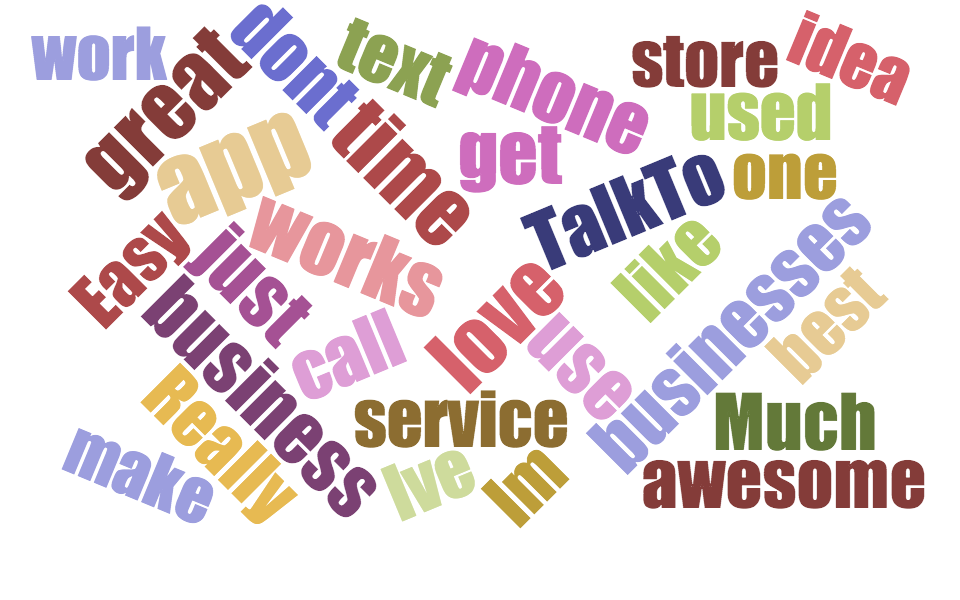
Data is essential for building and marketing great products. Some data is obvious and concrete (downloads, active users) while other data is a bit hidden. At TalkTo, I set out to qualitatively understand how people use our product, what they thought about it, and willingness to pay. Aside from the traditional approaches, I found a great trick: Word Tree iOS and Android app reviews. First, I downloaded TalkTo's reviews from App Annie (Reviews Tab --> Download CSV). Super simple. Then, I took all 1,436 reviews (4.8/5 stars #brag) and plugged them into Jason Davies Word Tree Template. Viola! Disparate reviews neatly tied together by root words. The most common phrasing is "This app is...{Amazing, Awesome, Great}." I then played around to understand how people use TalkTo; I did this by setting the root to "I use." What do disgruntled people say, and why? I found this out by creating the root "doesn't work." What are people willing to pay for TalkTo? I set the root to "pay" and gained insights. Below are some of the roots I explored. You can also play with The TalkTo Word Tree on your own. In conclusion, plug reviews, customer emails, survey results, etc into Jason's word tree and watch the insights unfold. I built this quick and dirty model to calculate an advertisers' willingness to pay for an ad unit. This framework has come in handy as I think about TalkTo, so I wanted to share it. Please note that this a back-of-the-envelope calculation to "ballpark" Customer Lifetime Value (CLV). By understanding your customers' CLV (CCLV), you can understand willingness to pay for a new customer. And that willingness to pay is your revenue! I have a much more complex CLV model that I will clean and publish at a later date. Step 1: What is an advertiser (i.e. your customer) willing to pay to win a sale? The first step is to understand how valuable a new customer is to the advertiser. To do this, we must first understand the price and profit margin of the product(s) being advertised. Let's say, for example, the advertiser is CVS and they place an ad next to someone searching for sunscreen lotion. (It's a cold, dreary day in Cambridge so I'm dreaming a bit.) Let's say the sunscreen retails at $10 and that CVS's gross margin is 20%. Thus, CVS grosses $2 on that unit ($10 x 20%). Is $2 CVS's willingness to pay for this beach-goer? Close, but not quite. If CVS believes they will only capture this person one-time, then they will want to pay a fraction of $2. Paying any more means that they will lose money on the transaction. However, if sunscreen buyers typically buy 3 additional items for a total basket of goods valued at $40, CVS would be willing to pay up to $8 (4 units at $10 average with a 20% margin). Please note these are dummy numbers. I've set the model up so you can get to this number two ways. Since CVS expects a $40 basket of goods, simply plug in $40 of revenue. The other way to think about - and the preferred way to think about it - is to place a multiple on gross profit. In other words, CVS is willing to pay 4 times gross profit of $2, or $8. By using a multiplier, you can use a fraction of gross profit. 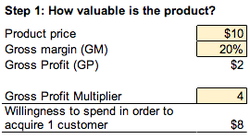 Step 2: Calculating the advertisement rate Ok, so we've roughly calculated what your customer is willing to pay to acquire a customer. So meta. Now, we have to figure out how much the advertiser is willing to pay to show an ad to 1,000 people, i.e. CPM. Now, I know what you're saying: CPM is so 2002. You're right, but we are looking at this from the vantage-point of the platform owner -- think Facebook, Twitter, TalkTo. Thus, CPM is crucial because the platform has to attract and support those users. In other words, a platform cannot begin to think about advertising until it has several thousand "M." In the model, I take a two step approach by first asking "what percent of people see the ad and take an action" followed by "of those that take an action, how many convert to customers." This just gives you flexibility to think through the problem. Using the CVS example, let's say that 1% of people take an action and 10% of those convert to customers. Thus, 1 person in 1,000 converts to a customer WHICH means that CVS would be willing to pay up to $8 CPM. At $8, they break-even on variable costs; above $8 they lose money. 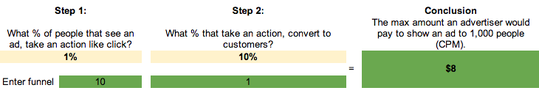 Key Insights As you think about your customers' customer life time value, remember a few things.
|
 JONATHAN STEIMAN
I'm the Founder and CEO of Peak Support. This blog is my take on early-stage companies and innovation. Every so often, there may be a post about culture, networking, family -- you name it. After all, what is a blog if it isn't a tad bit unstructured.
Archives
December 2016
Categories
All
|